
Onboarding Dashboard & Customer CRM — staff guide
1. The fleet grid: who needs attention today
Section titled “1. The fleet grid: who needs attention today”Open UI.Internal → Onboarding and you land here: one row per customer org, sorted worst-health first so the orgs that need you are already at the top.
- The stat tiles across the top (Signup, Onboarding, Live, Needs attention, Watch) are counts and filters — click Needs attention to show just the red orgs.
- Search jumps to an org by name; the lifecycle segmented filter narrows to a stage (cancelled hidden by default).
- The health pill (green / amber / red) is your triage signal.
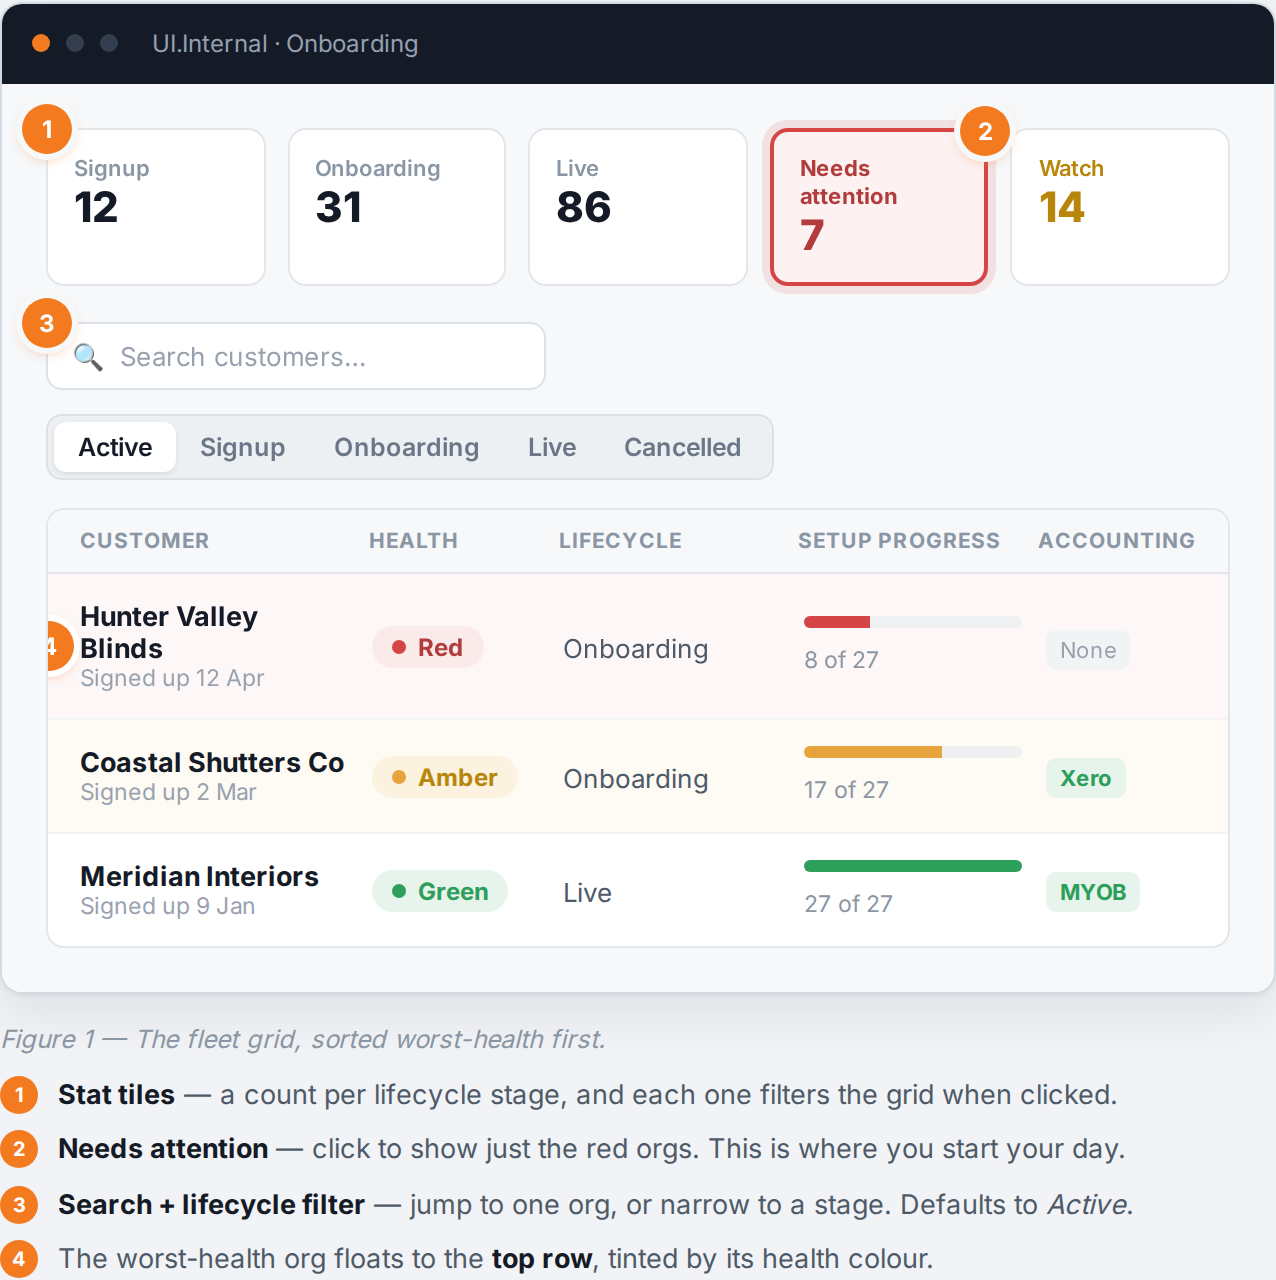
Figure 1 — the fleet grid. Stat tiles double as filters; “Needs attention” is where you start your day.
2. Reading a row
Section titled “2. Reading a row”Each row packs the triage signals: Health (dot + the top reason, e.g. “No sign-ins for 34 days”), Lifecycle pill (📌 when a staff member pinned it), Setup progress (bar coloured by health + “n of m”), Activity (checklist idle days · last sign-in · active users), and Accounting (Xero / MYOB badges).
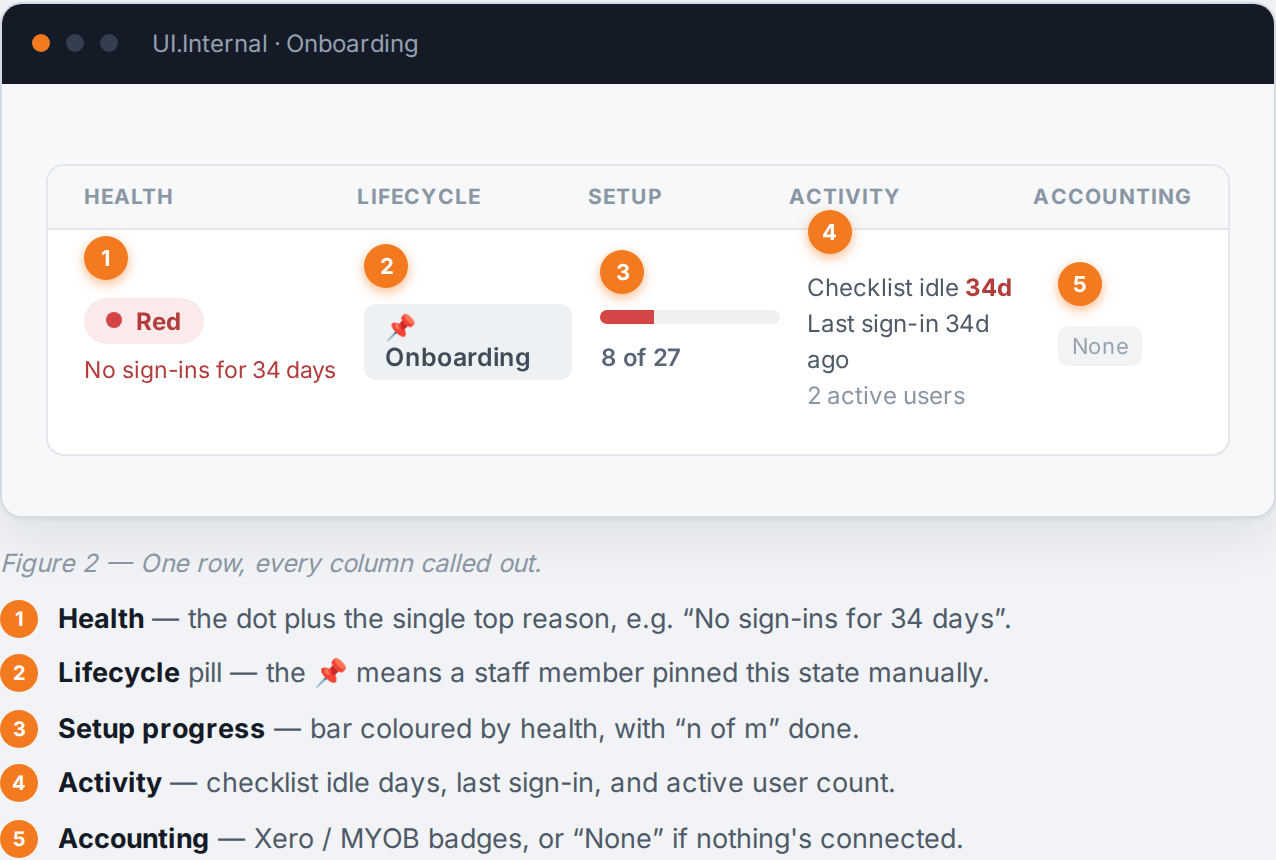
Figure 2 — a row: health + top reason, lifecycle, progress, activity, accounting.
3. Health: what green / amber / red mean
Section titled “3. Health: what green / amber / red mean”- Red — likely churn signal: no sign-ins in 30+ days, or setup stalled / never-started for 30+ days.
- Amber — needs a nudge: the 14-day versions of those, or no accounting integration connected 30 days after signup.
- Green — healthy.
The chip shows the triggering reasons on hover. A daily email digest lists the red orgs (cancelled orgs are excluded).
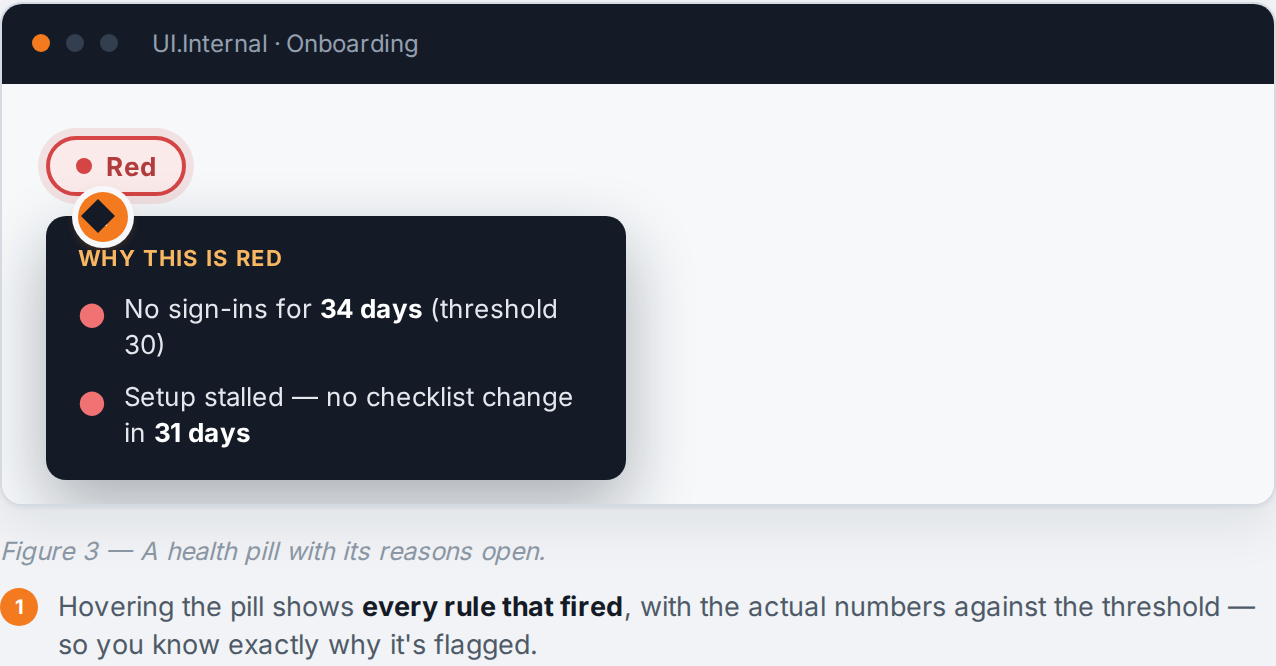
Figure 3 — health chips and their reasons.
4. Lifecycle: signup → onboarding → live → cancelled
Section titled “4. Lifecycle: signup → onboarding → live → cancelled”BUZ derives the lifecycle automatically — a customer moves to Live once setup is complete and they’re signing in. You can pin a state manually when reality differs (e.g. mark a customer Live even with two checklist items open). Use Set state to pin; pinning stops auto-movement (📌), and Un-pin hands control back to automation.
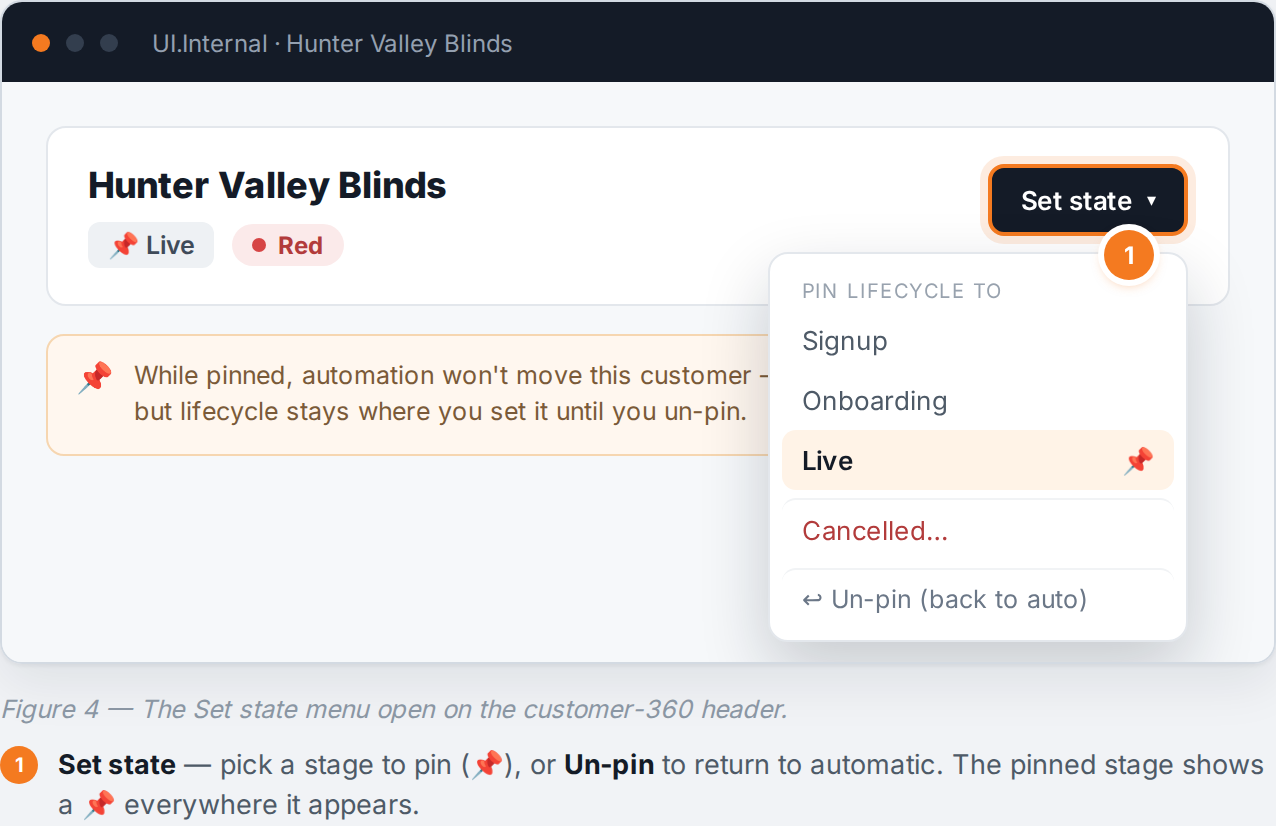
Figure 4 — the Set state menu. Pinning stops auto-derivation until you un-pin.
5. Cancelling a customer
Section titled “5. Cancelling a customer”Set state → Cancelled opens a dialog that requires a reason (price, missing features, too complex, switched to competitor, business closed, never onboarded, other) plus an optional note. Cancelled orgs drop out of the default Active filter and out of the health digest.
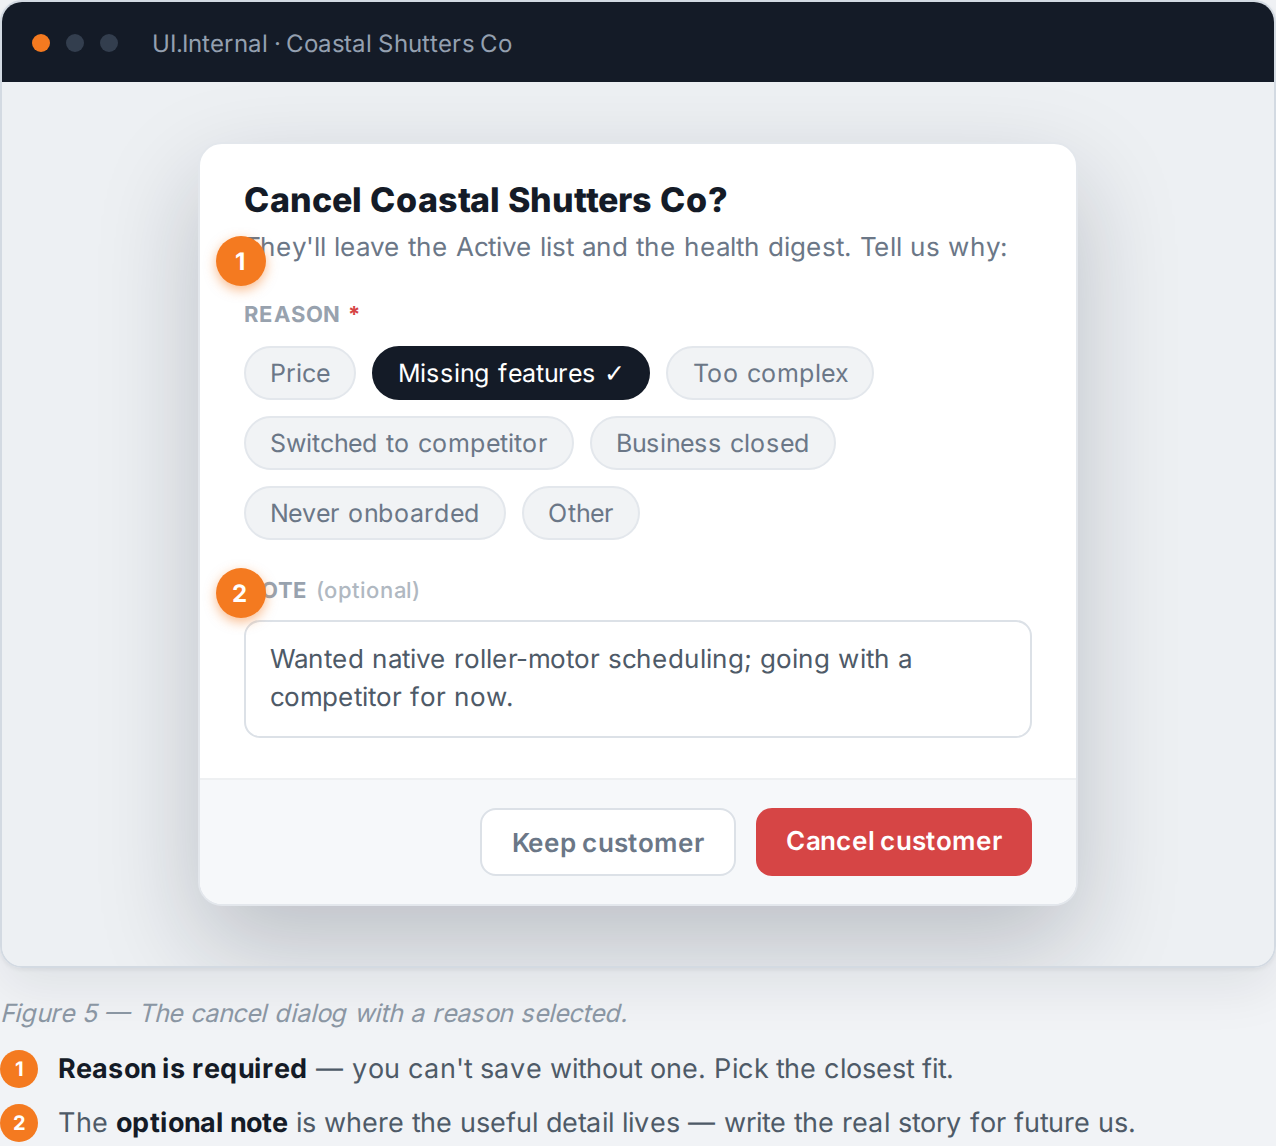
Figure 5 — the cancel dialog. A reason is required before you can confirm.
6. The customer 360 page
Section titled “6. The customer 360 page”Clicking a row opens the per-customer page (its own URL you can bookmark/share) — header (lifecycle + health), a facts row, and three areas below: timeline, the read-only setup checklist, and contacts.

Figure 6 — the customer-360 page.
6a. Timeline (the CRM heart)
Section titled “6a. Timeline (the CRM heart)”A reverse-chronological feed mixing your notes (and logged calls/emails — pick the type, type the
note, Add), system events (auto-written: “Went live”, lifecycle changes), and imported
history from the old tools, grouped by year and collapsed so recent activity stays on top — expand a
year to read the old BSS/BCP entries (each keeps its original reference, e.g. BCP-42).
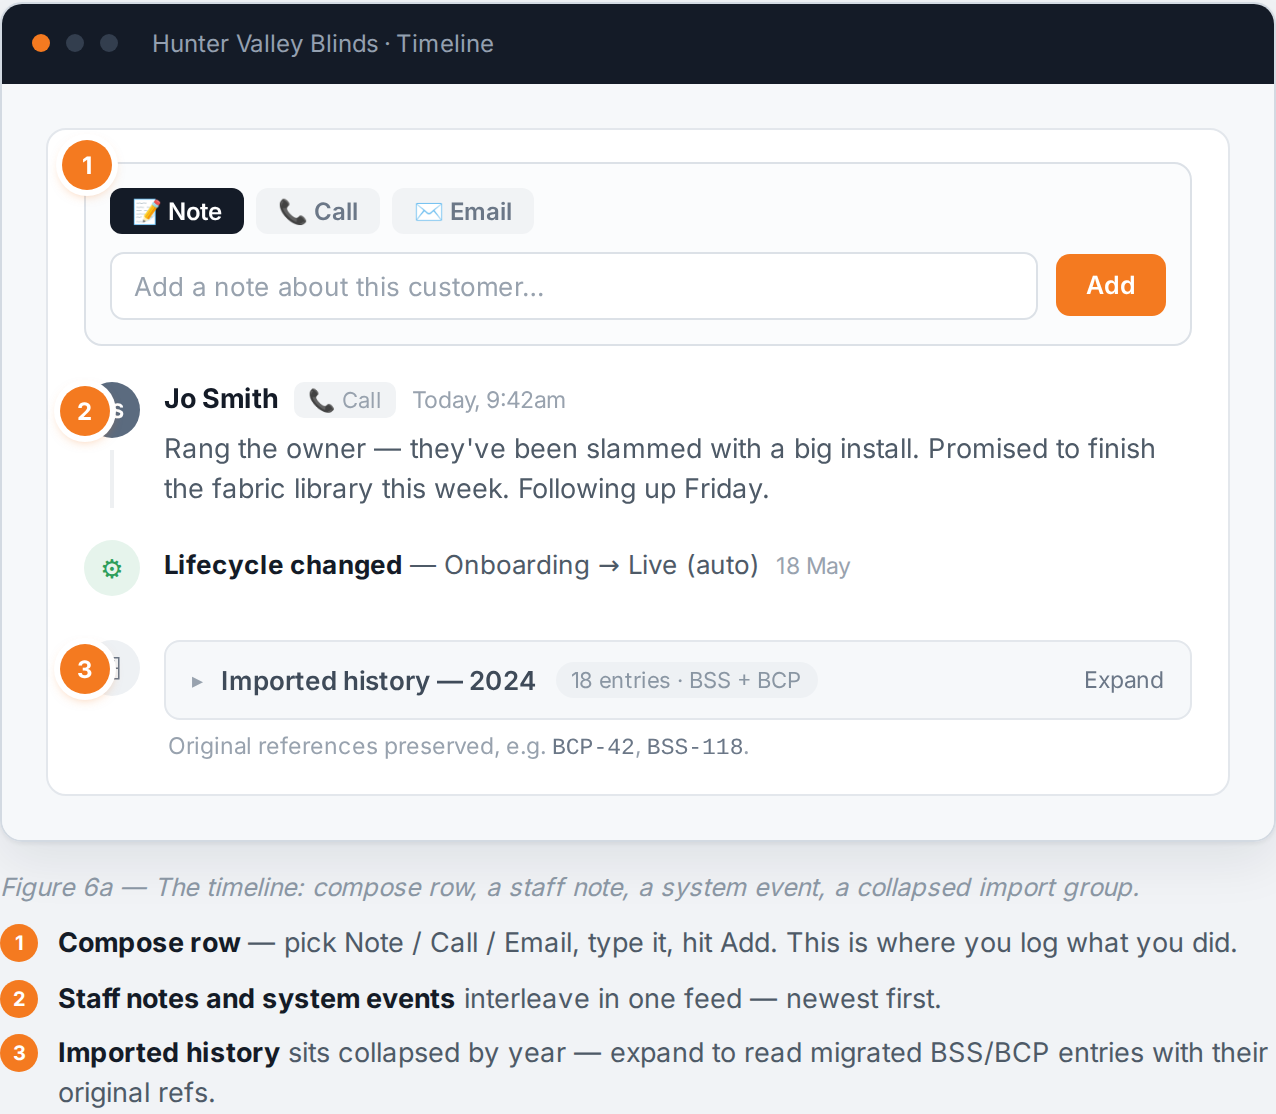
Figure 6a — the timeline: compose row, staff notes, system events, and collapsed imported history.
6b. Checklist detail & contacts
Section titled “6b. Checklist detail & contacts”The read-only checklist (module, task, status, assignee, note) shows exactly where a customer is stuck. Contacts is a light list for people who aren’t system users — an owner’s mobile, an external accountant — with add/remove.
Daily rhythm
Section titled “Daily rhythm”Start on Needs attention, work the red then amber list, log what you do on each customer’s timeline, and pin / cancel as reality dictates. That’s the loop — the dashboard keeps the fleet honest and the timeline keeps the context.